Voronoi tessellation
Introduction
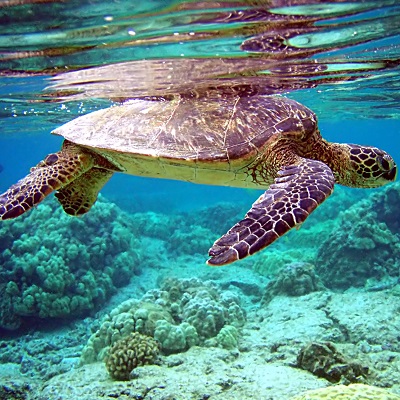
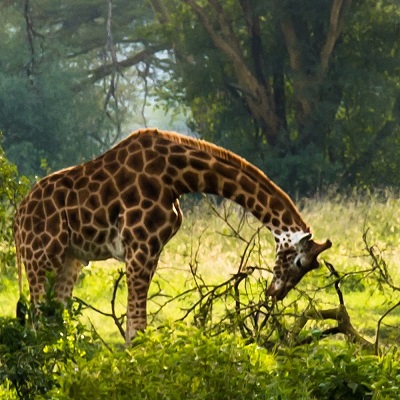

Green sea turtle, Brocken Inaglory, Wikimedia Commons - Giraffe in Nairobi, Summer kamal el deen, Wikimedia Commons - Veins in a Poinsettia leaf, Fasaxc, Wikimedia Commons - Algorithmically generated Voronoi pattern with Random Seeds.
A simple Voronoi diagram can be described as: Given a finite set of points, called seeds, sites or generators, in a 2D plane. Each point lies in a corresponding region or cell. A seed's corresponding Voronoi cell consists of every point in the plane whose distance to this seed is less than or equal to its distance to any other seed in the plane. The line segments of the Voronoi diagram are all the points in the plane that are equidistant to the two nearest seeds. The Voronoi vertices (aka nodes) are the points equidistant to three or more seeds.
Voronoi diagrams are used to model phenomena and processes involving growth or spatial division, such as cell architecture in biological tissue, microstructure of polycrystalline metal, nearest neighbor searches, mesh generation, etc, etc.
Fig.2. forming a Voronoi diagram by radial growth from a number of randomly positioned seeds.
More about the seeds
In figure 2 the seeds are points, randomly positioned in the plane. We can also position the seeds in a certain pattern. In addition, seeds do not have to be points; in a plane a seed can be any line, circle, curve, etc.
Voronoi parabola
In figure 3 a number of seeds are positioned on a straight horizontal line and one seed is positioned above or below that line. In this JavaScript application you can change the number of seeds on the horizontal line and change the distance to the point below or above that line and see what effect this has on the shape of the cell.
Fig.3. A Voronoi diagram approaching a parabolic arc.
The more the number of points on the horizontal line approaches infinity, the more the edge of the cell belonging to the one point above the horizontal line looks like a parabolic curve. And indeed, a geometrical description of a parabola involves a point, the focus, and a line, the directrix: a parabola, being the locus of points equidistant from both the directrix and the focus. An infinite number of points on a straight line is actually a straight line, and hence a parabola can be viewed as a Voronoi diagram of two seeds: a point and a straight line.
Seeds of all sorts
So, seeds of a Voronoi diagram are not limited to points. In a plane a seed can be any plane figure e.g. a line, a circle, a curve, a polygon. Figure 4 shows some examples.
Fig.4.
- Voronoi cells of two point seeds within a rectangular seed.
- Voronoi cell of one point seed within a circular seed (a definition of an ellipse by focus and circular directrix).
- Voronoi cell of one point seed within a square seed.
Symmetric patterns
Every symmetry of a set of seeds is also a symmetry of the corresponding Voronoi diagram. So, using a symmetric arrangement of points in a plane, or any set of seeds with some set of symmetries, results in a symmetric tiling of the plane. Figure 5 shows two examples of symmetrical arrangements of point seeds.
Fig.5.
- An arrangement of point seeds based on Helmut Vogel's model for the pattern of florets in the head of a sunflower, a form of Fermat's spiral involving the Golden Angle.
- An arrangement of point seeds combining a number of evenly-spaced arrays of points.
Figure 6 shows symmetric Voronoi tilings based on the seed arrangements of figure 5.
Fig.6. Voronoi tilings (with a color gradient effect) generated from symmetric point seed arrangements.
Disc phyllotaxis
In 1979 the German physicist Helmut Vogel proposed a model for a close packing pattern of florets (disc flowers) in the flower head (pseudanthium) of asteraceae flowering plants, like sunflowers, daisies or asters. The florets eventually mature into seeds and are arranged spirally. His model is a Fermat's spiral, expressed in polar coordinates by r = c√n and θ = nϕ where r is the radius from the center, θ is the angle, n is an index number of a floret, c is a constant scaling factor and ϕ is the golden angle ( ϕ = π(3 − √5) ≈ 2.399963 [rad] ).
The polar coordinates are describing geometrical points, but the florets, the flower seeds, can be modeled as them emerging from these points by radial growth, described by a Voronoi diagram (see figure 7).

Fig.7.
- Photo of a head of a sunflower with spirally arranged florets. Helianthus flower, L. Shyamal, Wikimedia Commons.
- Voronoi model of a sunflower head with spirally arranged florets.
Just for fun
Just a final animation for fun. The constant scale factor c in Vogel's model is being animated using Perlin noise, making the Voronoi diagram appear to be the surface of a living creature.
Much more about Voronoi diagrams
This was just a brief and shallow view upon some aspects of Voronoi diagrams from a certain perspective. Many further extensions to this basic scheme are possible, such as weighted seeds (multiply all distances in a cell by some factor), other distance functions (metrics) or diagrams in more than two dimensions.